Share anh em Kênh Telegram share kèo nhóm VIP Wolf Signal

Mới mua được vài nhóm VIP nên share cho anh em ăn chung.
Trước mắt mình share trước nhóm Wolf Signal, sau này mình mua thêm thì share thêm kèo nhé

Link Telegram : https://t.me/wolfsignalfree
Link Group Facebook : https://www.facebook.com/groups/196753944268249/


upload_2018-4-24_19-25-44.png
 

Attachments

  • upload_2018-4-24_19-25-40.png
    upload_2018-4-24_19-25-40.png
    99.8 KB · Views: 173
Last edited:
#TKS Considering the movement of this asset for the current year, you can see that after the completion of the corrective rollback, the market found a range of its support, then began to gain volume and made a rebound, after the first wave of which you can see an impulse break with a subsequent rollback. At the moment the market looks bullish, it can fluctuate in the range of 310-280, but has the potential to follow the resistance shown on the chart.
photo_2018-04-24_06-22-08.png

photo_2018-04-24_06-22-20.png
 
#BTC The market is getting closer to the area of strong support. Breaking this level and fixing below the 8800 mark will indicate a further negative scenario for the development of the asset.
photo_2018-04-25_18-42-40.png
 
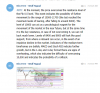
#BTC The closure of the day's candle can determine the further scenario for the development of this market. The price is still in the safe zone and from the current level it is more likely to stay within the cloud than to step down. If the candle closes above the lower edge of the Ichi cloud, then the scenario of movement inside the cloud with the continuation of the growth wave formation becomes relevant, and from now on the lower face of the cloud will act as a support. With negative developments and the closing of the daylight candle below the cloud, we will be met by a downtrend line, which we recently overcame, but already as support. Price can take a course along its direction, before making another attempt to break even higher. During the current month, we received a good wave of growth, and also overcome the most important long-term resistance of this year! Such growth, as a rule, should be accompanied by a corrective rollback and a search for new levels of support, which we can now observe. Altoquine markets can behave the same way: corrective rollback in search of support with a subsequent set of volume and the formation of the next wave of upward movement.
 
#VIBE Can provide a good opportunity both in the medium and long term. The market follows an uptrend and from the current price range there is a good chance to form growth within the limits of the corridor 4000-4500, but we can face resistance levels that are marked on the 4-hour chart, they will be our short-term goals. Despite the possibility of some consolidation or decline at the local level, the market looks positive and is ready to continue forming the upward movement.
photo_2018-04-26_08-45-26.jpg

photo_2018-04-26_08-45-41.jpg
 
#BCPT A good reduction for an additional purchase. From the current level, the target levels are 6400, 6630, 6900, 7100 and 7400. Higher target levels are still active and relevant, but from the medium-term perspective.
photo_2018-04-26_09-11-23.jpg

photo_2018-04-26_09-11-37.jpg

photo_2018-04-26_09-13-58.jpg
 
#SC
For the current month, the first recommendation and buy signal for the Siacoin asset was given at a price of 171, on the eve of the breaking of the triangle and the subsequent formation of impulsive growth. After leaving the template, the market received impulsive growth (with the achievement of the first goal) and a regular corrective rollback, after which we advised to make an additional purchase. Then we observe an impulsive growth reaching the extreme area of our target markings (the increase in value was + 42%) and subsequently another regular corrective pullback. April 23 at a cost of 219 gave a recommendation to buy and warned of the great potential of the market, as was the target area around 395, which has already been achieved. Since the last recommendation, an increase in value of + 93% has been received, and since the first recommendation + 148%. Now the market will look for and test new levels of support and determine the nearest resistance for future long-term growth. At the moment, we are watching the asset and we continue to analyze it; we remind once again that in the long term Siacoin is a good choice for investing.
photo_2018-04-26_10-11-16.jpg
 
#MTL The current price range is a good area for opening new long trades, the market is in the local support area and is approaching the long-term uptrend line, which positively influences the creation of the upcoming rebound. Above us meets the resistance level of Fib 0.236, which is the main medium-term target zone. We recommend that you pay attention to this asset.
photo_2018-04-26_12-05-31.jpg
 
#ADX At the moment, the market is rebounding from the Fib 0.236 level and may be in the range of 10,000-11,000 for some time, which is a good zone for opening new long positions, as all previous goals were achieved after the impulsive growth on April 22. The market should not fall below, maybe some time will go sideways, but ultimately has a prospect of trading at higher levels.
photo_2018-04-26_12-19-08.jpg

photo_2018-04-26_12-34-06.jpg
 
Last edited:
#FTC It follows the uptrend, making impulsive breaks, on the attached chart you can see the rebound points. The current area is a good zone for entering and opening long-term deals, the market looks positive, and the probability of growth is greater than the possibility of further decline. In the event of a decline, support meets at the 1950 level, from where we can bounce back to the trend line, in such a situation there will be a possibility of selling at the break-even level, but making an additional purchase at a lower level for the greater part of the deposit can also get a good profit.
photo_2018-04-26_18-14-40.jpg

photo_2018-04-26_18-14-55.jpg
 
#BTC If the price does not hold within the cloud, then a dense support area of about 8000 meets the bear, which will be very difficult for the bears to overcome. The most part of the market of alts shows good results, the market forms a new cycle. Do not worry too much about the possibility of a decline scenario, at the moment we see dense local support and further downtrend is unlikely. Even if some dump occurs, we will still get a strong rebound with a subsequent increase. The large scale of most assets looks positive and soon, after the consolidation is completed, we will be able to observe the continuation of the upward movement.
photo_2018-04-26_19-22-33.jpg
 
#VRC Very positive indicators of indicators of both medium and large timeframes. This market is characterized by impulsive breakthroughs, and at the current moment, if you remove the "noise" of candles in the chart settings and turn on the display as a line, you can see that we got a full-fledged corrective rollback, about -80% and now the market is in the range, with which can again form a rebound. At the moment, we are supported by resistance Fib 0.786, from the current level, we can expect a further increase in the value of the asset.
photo_2018-04-27_05-56-15.jpg
 
#WINGS Immediately after the publication of the signal, they received an impulsive growth in the form of an increase in the price by + 26.69%, followed by a pullback. To date, all goals are active and relevant, including higher target levels (medium-term). The current range of trade looks good for recruitment and further formation of subsequent growth.
photo_2018-04-27_07-18-57.jpg
 
#BTC The market remains within the cloud - a good sign, and most of the top-notch shows a reversal with the possibility of further growth on 4 and 6-hour timeframes. You can see how the assets follow the scenario of the classic Elliott Wave and right now the beginning of the 5th wave is being formed. We expect another growth with the fixation of profit at the peak of the peak at the time of overbought market, after which we can expect a regular corrective rollback.
photo_2018-04-27_07-51-39.jpg

photo_2018-04-27_07-51-53.jpg
 
#EOS
The main recommendation and buy signal was published on April 2, today the increase in the value of the asset is +167%. The pattern of the downward wedge and the analysis of the medium-term outlook have been fully and successfully worked out, the target levels have been achieved.
In the long term, the asset still has a huge potential, in 2018 EOS may well repeat the scale of growth as in ETH in 2017. For successful investment, we recommend to buy and hold in your portfolio in case of drawdowns.
photo_2018-04-27_09-10-40.jpg
 
#DGB Demonstrates a good rally, since the publication of our signal (April 11), the asset increased its value by + 47.24% and overcame the target level of 480.
photo_2018-04-27_10-19-27.jpg
 
#DGB And the first recommendation for the purchase this month was at the level of 250 with the target area of 400-450, which was also successfully achieved, the resulting profit is +80%
photo_2018-04-27_10-19-27.png
 
#HSR The target levels reached are becoming supportive and the market continues to demonstrate positive trading opportunities. On average timeframes it looks good, but just like other markets can be adjusted at this level. Since the publication, this asset has demonstrated good growth and fulfilled all the main goals, bringing profit of about 81%. The market has the opportunity to reach the range of 1777-1977 from the mid-term perspective. Right now, the price is trying to break through the resistance of 1200, as soon as it is possible to strengthen above this mark, Hshare will aspire to higher levels of trade. We can open long transactions right from the current moment, in the event of a price reduction, we will have the opportunity to buy at a lower price with an increase in the volume of the purchase as the decrease, which will give a greater profit at the exit.
photo_2018-04-27_15-05-09.jpg

photo_2018-04-27_15-05-31.jpg
 
#STORJ The market fulfilled all of these goals in the signal, and we got a good profit. But the subsequent analysis indicates continuation of the trend. Probably the market will repeat the rebound after a slight decline. Stoch RSI looks ready to increase, but can still decline.
 

Announcements

Today's birthdays

Forum statistics

Threads
418,300
Messages
7,069,758
Members
170,432
Latest member
bodl

Most viewed of week

Most viewed of week

Back
Top Bottom